





Who wins the H-1B lottery?
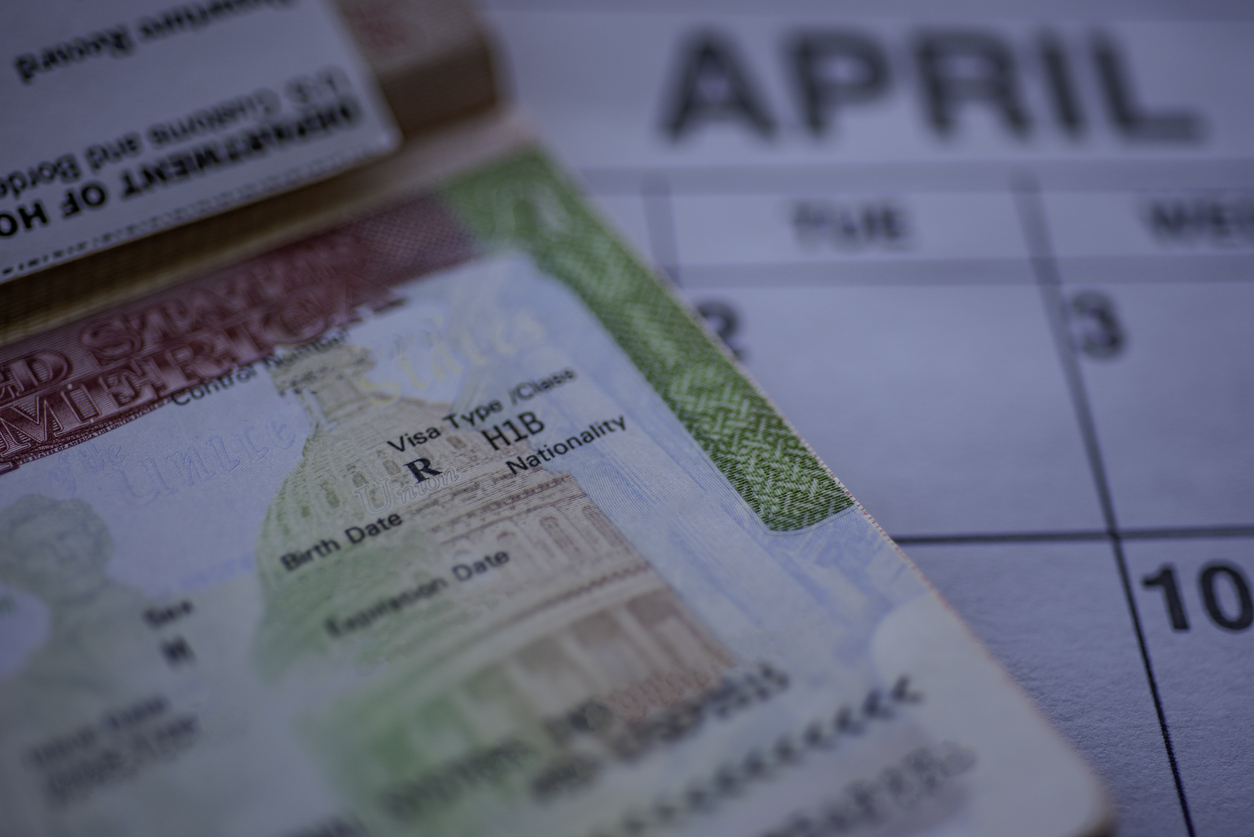
The H-1B is the main US temporary work visa for college-educated foreign professionals. Employers want far more of them than Congress allows, so the visas are allocated via lottery. Federal records obtained under the Freedom of Information Act (FOIA) cover 363,024 approved petitions from the four FY2021–24 lotteries, and they reveal a group that differs from the US working-age population in many respects. Part two of this series examines what those workers studied and the type of work they do.
H-1B Worker Education & Sectors of Employment
The odds are one in five
The H-1B is the largest US temporary work visa for foreign professionals in “specialty occupations.” This means a job that requires a bachelor’s degree or higher in that specific field. H-1B visa holders range from software engineers to accountants to doctors. Congress caps new visas at 85,000 a year: 65,000, plus 20,000 for people holding a graduate degree from a US university. Employers submit registrations for far more, so each spring the government runs a lottery. Across the four FY2021–24 lotteries, employers submitted 1.8 million registrations; about one in five ended in an approved H-1B petition. Those 363,024 approvals are the basis for the analysis that follows.
Read more
Employers, not workers, enter the lottery. A company submits a registration naming each person it wants to sponsor (the “beneficiary”), and US Citizenship and Immigration Services (USCIS) draws winners from eligible registrations. Each registration drawn allows one petition to be filed for that worker, and the worker can take the job only if USCIS ultimately approves the petition.
Employers submitted 1,847,661 registrations across the four FY2021–24 lotteries, of which 1,804,286 met USCIS eligibility requirements. Just under a third were drawn in the lottery. A petition was filed on two-thirds of those draws — some employers did not end up submitting petitions, despite winning the draw — and one registration in five ended in an approved petition. The following analysis is based on the 363,024 approved petitions that meet our sample criteria, which the notes set out in full. Universities and research organizations are not part of these data as they are exempt from the cap and hire outside the lottery.
Highly educated, across the board
By formal training, approved H-1B petitions went to what might be one of the most credentialed groups in US working life— 58 percent held a master’s degree or higher, compared to just 14 percent of the US native-born population and 15 percent of the total foreign-born population. Virtually all approved H-1B petitions went to someone holding at least a bachelor’s degree.
Additional notes & methods
The H-1B bar. Highest degree is recorded on 82.6 percent of all approved petitions, and on 82.4 percent of those age 25 and over, which is the universe this figure uses. Petitions that do not name a degree are set aside, so the bar is a share of those that do.
Master’s or higher. The column to the right of each bar adds three levels together: master’s, professional and doctoral degrees. It is summed from the exact shares and rounded once, not added up from the rounded labels inside the bar.
What the two lowest categories contain. The same schooling on both sides, built from what each source publishes. On the H-1B side HS or less is no diploma or high school graduate, and Some college is some college credit, a year or more of college with no degree, or an associate’s degree. On the Census side HS or less adds three published rows — less than 9th grade, 9th to 12th grade with no diploma, and high school graduate — and Some college is its single “some college or associate’s degree” row.
US native-born. A US citizen at birth: born in the fifty states or the District of Columbia, born in Puerto Rico or a US island area, or born abroad to a US-citizen parent.
US foreign-born. Everyone who was not a US citizen at birth, whether or not they have naturalized since.
Rounding. Each label is rounded from its own exact share, so a bar’s labels may not sum to 100 and may not sum to the master’s-or-higher column. Hovering or tapping a segment shows its share to one decimal.
Young and graduate-trained
The difference between approved H-1B petitions and the US working-age population is especially pronounced when comparing the age and education levels of the two groups in conjunction. The US working-age population is spread widely across combinations of age and level of schooling. By comparison, approved H-1B petitions concentrate in one combination. Almost half of them, 46 percent, go to someone in their late twenties or early thirties holding a graduate degree, a group that only accounts for 3 percent of the US working-age population.
Additional notes & methods
What each bubble is. Four age bands across by four education levels up. Every petition and every person falls in exactly one of the sixteen boxes, and a group’s sixteen bubbles sum to 100 percent, so the two sets are directly comparable.
How the education levels are grouped. Four levels on both sides. On the H-1B side HS or less is no diploma or high school graduate; Some college / Assoc. adds some college credit, a year or more with no degree, and an associate’s degree; Bachelor’s is a bachelor’s degree; and Graduate / Prof. adds master’s, professional and doctoral degrees. The Census rows are collapsed to match: less than 9th grade, 9th to 12th grade with no diploma and high school graduate make up HS or less; some college with no degree and an associate’s degree make up Some college / Assoc.; and its single “graduate or professional degree” row is Graduate / Prof.
Coverage. Highest degree is recorded on 82.6 percent of approved petitions. The 63,144 with no degree recorded are excluded from the grid, so the H-1B bubbles sum to 100 percent over the petitions that report one.
The bands. Unlike the rest of this page, which covers ages 20–64, the bands here follow the ACS table: 18–24, 25–34, 35–44 and 45–64, with 65 and over dropped. Almost no petition is for someone under 20, so the youngest band holds the 20–24 group.
For graduate degrees, most approved petitions go to people already in the US as students
Where were these workers based when their petitions were filed? Of the 171,607 approved petitions for someone with a master’s degree or higher, 133,316, or 78 percent, went to people already in the United States; they switched from a different US visa rather than being hired from overseas. Of those, 92 percent went to someone who was on an F-1 student visa.
An F-1 is the visa international students hold, and it is the most common route to obtaining an H-1B. After obtaining a US graduate degree, a student can work for up to a year on Optional Practical Training (OPT), and for up to three years if the degree is in a STEM field. That window is long enough for an employer to enter them in the lottery two or three times, and a US master’s or higher degree also earns a second draw under the 20,000-place advanced-degree cap. The advanced-degree track is, in effect, the US graduate-school-to-worker-pipeline: the petition process largely selects students the United States has already trained.
Additional notes & methods
Already in the United States. The petition asked to change the person’s status rather than to notify a consulate abroad, meaning they were already in the US on some visa. The requested action places a petition on one side or the other on 99.9 percent of approved petitions; the 540 that request something else, such as extending or amending a stay, are on neither.
On an F-1. The current status as recorded on the petition, present for 99.3 percent of the advanced-degree petitions already in the US.
Petitions for someone with only a bachelor’s degree look remarkably different. Just 26 percent of bachelor’s-only petitions went to people already in the US. For more advanced degrees, the picture flips: about seven in ten master’s and doctoral petitions went to students already in the United States on an F-1 visa, and only 23 percent of master’s and 16 percent of doctoral petitions came from overseas.
Additional notes & methods
The F-1 bar is not everyone on a student visa. It counts only people who were already in the United States. 188,440 approved petitions record an F-1 as the current status; 9,208 of them, 4.9 percent, were filed from abroad — a student who had gone home, for instance — and those are counted in the abroad bar, because that bar is about where the person was rather than the visa they held.
Coverage. Each bar covers the petitions reporting a degree at that level; a degree is recorded on 82.6 percent of approved petitions. Where the person was is recorded on 99.9 percent, and for those already in the US the current status is recorded on 98.9 percent.
Rounding. Each label is rounded from its own exact share, so a bar’s labels may not sum to 100: the doctoral bar’s middle segment prints 12 percent from an exact 11.6 percent. Hovering or tapping a segment shows its share to one decimal.
Mostly computing and engineering
The degrees listed in the petitions cluster in a narrow set of subjects. 49 percent of the sample studied “computing”—a category that encompasses computer science, software, information technology, and data science—and another 21 percent studied some other branch of engineering. Nearly seven in ten, then, came from just those two fields. Computer science by itself appeared on 16.6 percent of petitions; the next-largest single field, information technology, appeared on 3.5 percent.
Additional notes & methods
Field of study. The primary field of the beneficiary’s degree, written as free text on the petition and present on 99.9 percent of approved petitions. The raw file holds 39,672 distinct entries, from COMPUTER SCIENCE to MASTER OF SCIENCE IN ELECTRICAL ENGINEERING to one-off spellings; we standardize them so that one field carries one name.
Aggregate categories. A degree counts as computing if its name contains any of computer, software, computing, informatics, cyber, information technology, information system or data science. It counts as engineering if the name contains engineer and none of those, so computer engineering and software engineering are counted as computing rather than engineering. Everything else falls outside both.
What the bubbles show. Each bubble is one field, its area proportional to that field’s share of the 362,766 approved petitions that name a field. Only the fifteen fields above 1 percent are drawn, together forming 49 percent of petitions; the rest is a long tail of smaller ones.
Software, over and over
The job titles employers list on these petitions all point one way. Among petitions that name a title, 28 percent contain the word “software,” and the three most common titles, “software engineer,” “software developer,” and “software development engineer,” really refer to the same type of role—one that comprises 18 percent of titled petitions.
Additional notes & methods
Job title. Free text on the petition, reported on 65.8 percent of approved petitions; every share on this chart is of those 239,046, not of all 363,024.
Seniority and level are not stripped. “Senior Software Engineer” is counted separately from “Software Engineer,” and “Software Development Engineer I” separately from “Software Development Engineer.” Folding them together would inflate the top title and hide that these are different jobs.
Abbreviations. Only whole-word abbreviations are expanded, so SR becomes SENIOR, SW becomes SOFTWARE and ENGR becomes ENGINEER. A longer word that merely contains those letters is left alone.
One sector hires most of them
Grouped by the kind of business the employer is in, one industry dominates: professional, scientific and technical services. It accounts for 64 percent of H-1B jobs, or 221,464 petitions. That same industry provides only 7.5 percent of all US private-sector jobs, so H-1B work is concentrated there more than eight times as heavily as in private-sector employment.
What do these sector names mean?
- Professional, scientific and technical services (NAICS 54). Firms that sell expertise: IT consulting and systems-design companies, management consultants, engineering and architecture practices, accountants, lawyers and scientific research labs.
- Manufacturing (31–33). Companies that make physical goods: semiconductors, machinery, cars, drugs.
- Information (51). Software publishers, internet platforms, data processing and hosting, telecom and media.
- Finance and insurance (52). Banks, investment and trading firms, insurers.
- Retail trade (44–45). Stores and e-commerce sellers.
Additional notes & methods
Coverage, and what “usable” means. Industry is the employer’s NAICS code, present on 99.9 percent of approved petitions. A code is usable when it is a standard length and its first two digits are a real sector; 999999, “not classified,” carries no industry information and counts as missing. That leaves a usable sector on 95.6 percent, 346,954 petitions, and every H-1B share here is of those, not of all 363,024 — the 16,070 without one are dropped.
What the US bar is. County Business Patterns counts private-sector payroll employment only, so it excludes government, the self-employed and most farm workers. Sectors the classification combines are shown combined: manufacturing 31–33, retail 44–45, transport 48–49.
The bottom line
By formal training, approved H-1B petitions went to what may be the most credentialed group in the US workforce, and a remarkably uniform one:
- 58 percent held a graduate degree, compared to 14 percent of the US native-born and 15 percent of the US foreign-born; virtually all held at least a bachelor’s.
- Obtaining an advanced degree in the US is the first step in the US graduate school-to-worker pipeline: about 71 percent of master’s-and-higher petitions went to people already here on a student visa, while 74 percent of bachelor’s-only petitions went to people hired from abroad.
- 70 percent studied computing or engineering, and computer science alone accounted for 16.6 percent of all approved petitions.
- The work mirrors the training: petitions were overwhelmingly submitted for software jobs, with 64 percent of approved petitions originating from a single industry sector, which provides just 7.5 percent of US private-sector jobs.